
나홀로 데이터 분석가의 1인 연구실
[시각화] plt.scatter()를 활용한 산점도 그리기 본문
0. 학습 환경
- matplotlib: 3.3.4
- seaborn: 0.11.1
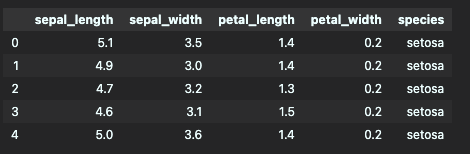
금일 학습에는 seaborn 라이브러리에서 제공하는 iris 데이터를 사용하고자 합니다.
seaborn에서 제공하는 다른 데이터셋은 '.get_dataset_names()'를 통해 확인이 가능합니다.
import seaborn as sns

sns.load_dataset('iris')

#다른 데이터셋을 확인하고자 할 때
sns.get_dataset_names()
1-1. 기본 산점도
우선 산점도는 불연속값(x,y)을 표시하는 데 주로 사용합니다.
기본적인 활용은 아래와 같이 x와 y값을 넣어주는 것으로 시각화가 가능합니다.
#도화지 사이즈 설정
plt.figure(figsize=(12,12))

#도화지 위에 산점도를 그리기
plt.scatter(df.sepal_length, df.sepal_width)

#도화지 출력
plt.show()
2. 산점도 파라미터
산점도에서 제가 사용하는 파라미터는 아래와 같습니다.
- s: 점 크기 변경
- c: 점 색상 변경
- marker: 점 모양 변경
- cmap: c에 따른 색상 변경
- alpha: 점의 투명도 변경
2-1. 점 크기
- 수치를 부여하여 점의 크기를 조정
- 데이터에 따른 크기 조정
plt.figure(figsize=(12,12))

#1. 특정 수치 만큼 점의 사이즈가 일관적으로 변경
plt.scatter(df.sepal_length, df.sepal_width, s=100)

#2. 특정 데이터에 따른 사이즈 조정
plt.scatter(df.sepal_length, df.sepal_width, s=df.petal_length*20)

plt.show()
2-2. 점 색상
- 특정 색상을 부여하여 점의 색상을 조정
- 데이터에 따른 색상 조정
plt.figure(figsize=(12,12))

#1. 특정 색상을 부여하여 점의 색상을 일관적으로 조정
plt.scatter(df.sepal_length, df.sepal_width, c='red')

#2. 특정 데이터에 따른 사이즈 조정
plt.scatter(df.sepal_length, df.sepal_width, c=df.petal_length)

plt.show()
💡 특정 데이터를 통해 색상을 변화할 때, cmap을 사용하여 색상을 지정해줄 수 있음.
💡 plt.colorbar()를 통해 camp을 그래프 우측에 표시해줄 수 있음.
plt.figure(figsize=(12,12))

plt.scatter(df.sepal_length, df.sepal_width, c= df.petal_length, cmap='cool_r')

#색상표를 좌측에 표시해줌
plt.colorbar()

plt.show()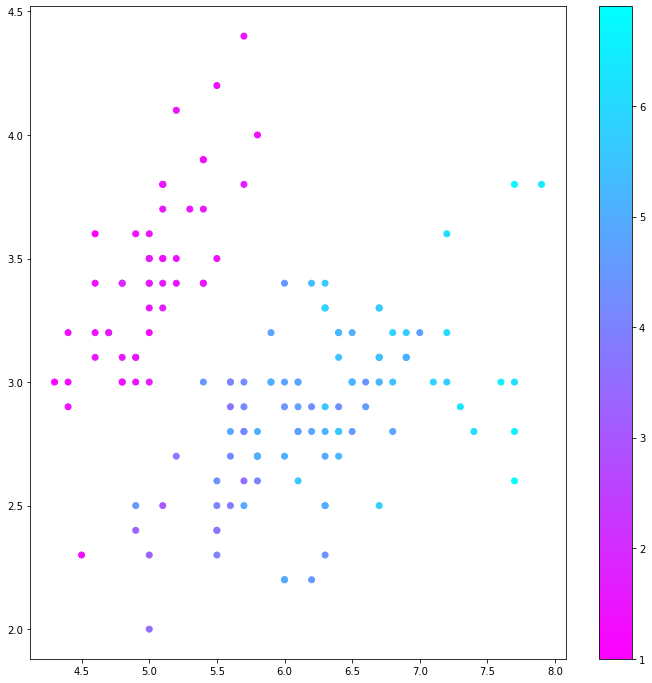
2-3. 점 모양
plt.figure(figsize=(12,12))

plt.scatter(df.sepal_length, df.sepal_width, marker='x')

plt.show()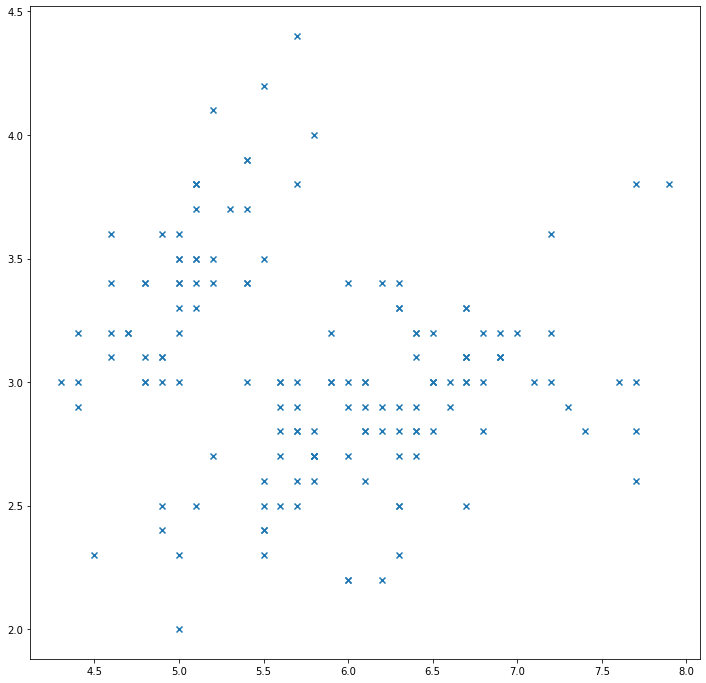
2-4. 점 투명도
plt.figure(figsize=(12,12))

plt.scatter(df.sepal_length, df.sepal_width, s=500, alpha=0.3)

plt.show()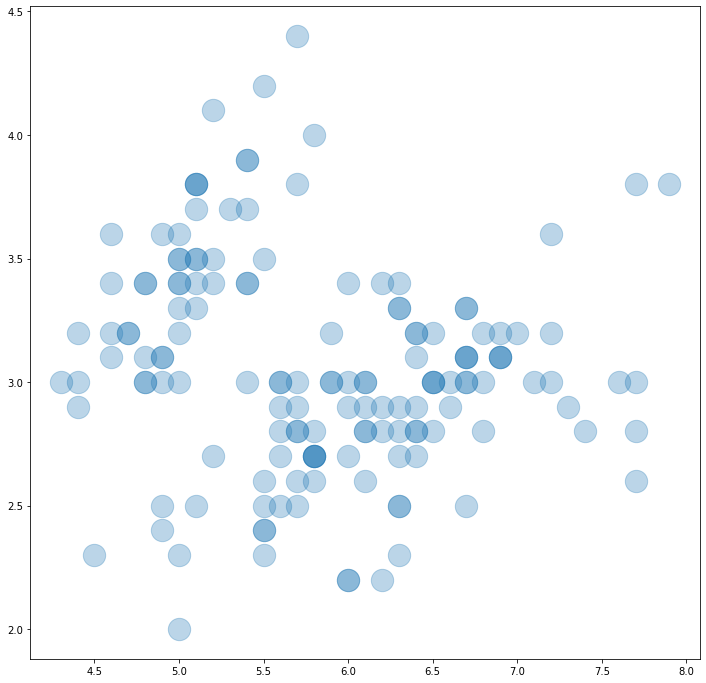
3. 파라미터 종합 사용
x1 = df.groupby('species').get_group('setosa')
x2 = df.groupby('species').get_group('versicolor')
x3 = df.groupby('species').get_group('virginica')

plt.figure(figsize=(12,12))

plt.scatter(x1.sepal_length, x1.sepal_width, marker='D', s = 100)
plt.scatter(x2.sepal_length, x2.sepal_width, marker='h', s = 100)
plt.scatter(x3.sepal_length, x3.sepal_width, marker='o', s = 100)

plt.legend(['setosa','versicolor','virginica'])

plt.show()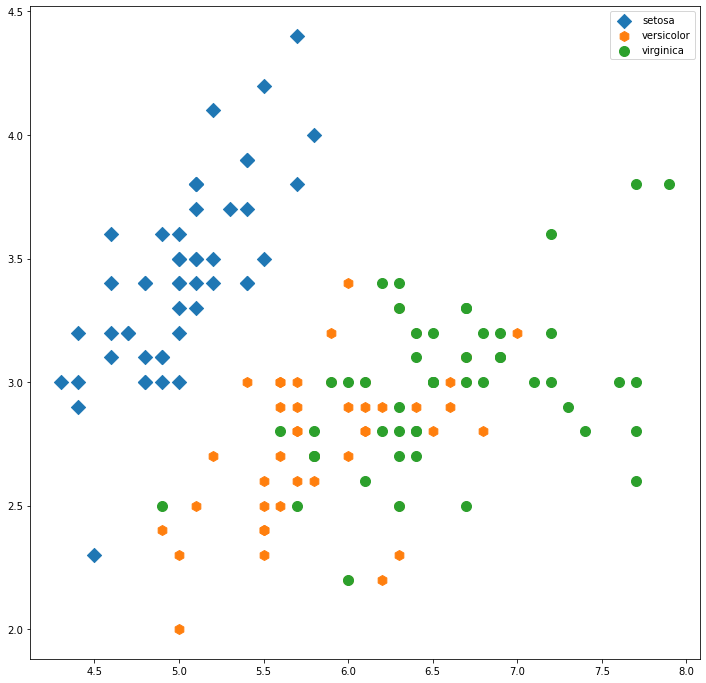
plt.figure(figsize=(12,12))

plt.scatter(df.sepal_length, df.sepal_width, s = df.petal_width * 300, c = df.petal_length, cmap='Spectral', alpha=0.5)

plt.colorbar()

plt.show()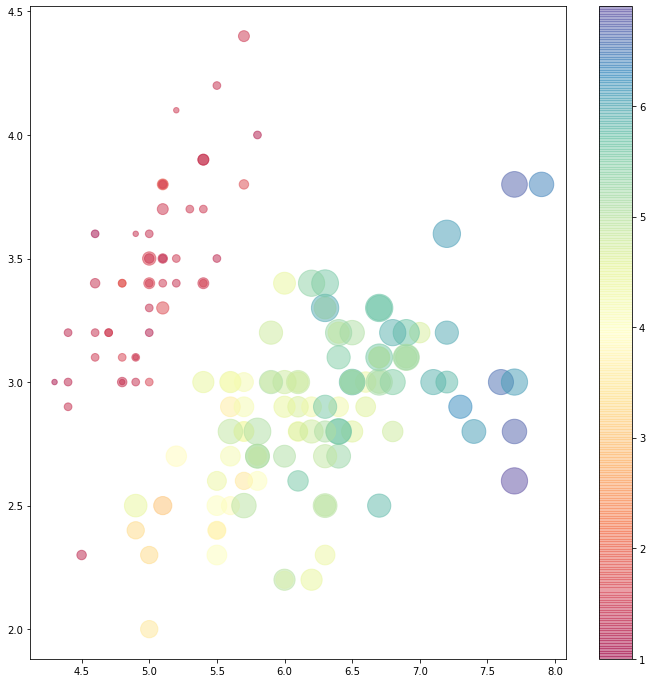
'Python > Theory' 카테고리의 다른 글
| [시각화] matplotlib 공통 함수 (0) | 2023.01.02 |
|---|---|
| [Python] 데이터 전처리를 위한 apply(lambda)문 사용하기 (0) | 2022.12.28 |
| [Python] tqdm을 통해 for, apply문 진행율 확인하기 (0) | 2022.12.27 |
| [Python] 라이브러리 설치 시 [WinError 5] 에러 대처하기 (0) | 2022.12.27 |
| [웹 크롤링] find_all 함수로 웹 페이지 내 Element 추출하기 (0) | 2022.12.26 |
'Python/Theory' Related Articles
more


Comments